可信执行环境 (TEE) - Automata Network 代码分析
基础信息
官网:https://www.ata.network/
GitHub: https://github.com/automata-network
docs: https://docs.ata.network/
重点关注项目
- https://github.com/automata-network/automata-sgx-sdk
- https://github.com/automata-network/sgx-prover
- https://github.com/automata-network/sgx-scaffold/tree/main
- https://github.com/automata-network/automata-dcap-attestation
- https://github.com/automata-network/SGXDataCenterAttestationPrimitives
文档关键信息
TEE 验证器的设计

带有 Scroll 的 TEE Prover 的架构有两个主要组件:
- SGX 证明器。一种链下组件,用于检查安全区域内区块执行后状态根是否与现有状态根匹配,并将执行证明 (PoE) 提交给 SGX 验证器。
- SGX 验证器。确认 SGX 证明器提出的状态转换正确性的 L1 合约。它还验证 Intel SGX 飞地提交的证明报告,以确保证明器的完整性。
Intel SGX 的链上验证
远程认证允许以编程方式验证英特尔 SGX 飞地的属性和完整性。这是建立并确保其执行的任何计算或数据处理都是值得信赖的关键过程。

https://docs.ata.network/tee-overview/tee-prover
多重证明器 AVS 的工作原理

- 任务提交:协议构建者参与 AVS 并提交多重证明任务。在汇总场景中,这包括对 L2 向 L1 提交的批量交易进行采样和证明。
- 验证器注册:独立操作员注册以承担这些任务。操作员利用可重现的构建来运行 TEE 验证器,并通过 Automata 的TEE Compile进行验证,以确保构建过程的完整性。
- 执行和证明:每个操作员(证明者)在其选择的 TEE 平台上执行任务。生成证明以验证执行的正确性和完整性。
- 链上验证:将证明提交至区块链,智能合约充当证明人的角色并在链上进行验证。
- 奖励发放:成功完成任务后,向操作员发放奖励。
https://docs.ata.network/tee-overview/multi-prover-avs-eigenlayer
multi-prover-avs 代码分析
GitHub: https://github.com/automata-network/multi-prover-avs/tree/main
目录结构
═── contract:Solidity合约,包括AVS合约和证明层合约。
│ │ │ ── dcap-v3-attestation:英特尔 SGX 的 Dcap 认证链上验证库。
│ │ ── src:AVS 合约的源文件。
│ └── test:智能合约的测试。
═── operator:运算符实现。
═── aggregator:聚合器实现。
═── sgx-prover:TEE 证明器的 sgx 版本。
AVS任务描述
任务定义:寻求利用可信执行环境 (TEE) 内的独立执行来确定其正确性的状态转换或计算过程。
struct StateHeader {
    uint256 identifier;
    bytes metadata;
    bytes state;
}
这是提交给证明者的状态头结构,下面是详细解释:
- identifier:处理任务的标识符,用于区分不同类型的任务,并用于计算各个算子的贡献
- metadata:描述特定任务的元数据,例如keccak256(abi.encodePacked(chainID, blockNumber))用于证明特定区块高度的区块链状态的任务的元数据
- state:TEE 证明器产生的最终状态,可以是区块链的根状态,也可以是 zk 电路证明的语句
AVS 架构
AVS 的架构包含:
- Eigenlayer 核心合约
- AVS 合同
- 未来将添加 ServiceManager,允许操作员提交任务、奖励和削减逻辑
- 鉴证合约
- 管理各种 TEE 证明器的注册/注销和活跃性,它将验证不同 TEE 平台的认证,例如 Intel SGX、AMD SEV、ARM TrustZone 等
- TEEProverRegister 是运营商和聚合器使用的认证层的接口
- 聚合器
- 汇总来自操作员的 BLS 签名并将汇总状态提交给 AVS
- 与自动机证明层交互,检查每个证明者(操作员)的有效性,未能通过证明验证或活性挑战的将被拒绝处理任务,直到其再次有效。
- 操作员
- 从 TEE 证明者处获取状态证明并将其提交给聚合器
- TEE 证明器
- TEE 证明器可以证明给定任务的最终状态,例如 zk-rollup L2 的证明器将在 TEE 内部执行区块并在特定区块处生成根状态
AVS 工作流程
以下是工作流程的详细图表

成分:
工作流程分为两部分:
-
设置
- 按照Eigenlayer 的文档进行质押并注册成为 Multi-prover AVS 的运营商
- 生成证明并注册为 TEE 证明者,不同的 TEE 技术,证明及其生成过程不同。例如,dcap-v3-attestation是验证 Intel SGX Dcap 证明的合约
-
在职的
- 除了操作员处理任务之外,他们必须定期完成活性挑战,否则将被视为无效,其提交将被聚合器拒绝
- 算子获取新任务并在 TEE 内部完成计算
- 操作员签署最终状态并将其与签名一起发送给聚合器
- 聚合器将在接受运营商的提交之前获取其有效性
- 聚合器聚合所有 BLS 签名并提交给 AVS 服务管理器
TEE 委员会和法定人数

TEE 委员会是一组负责处理特定类型任务的法定人数。例如,在特定区块高度证明 Zk-Rollup 的根状态。操作员无需主动选择委员会,而是通过加入法定人数自动属于委员会。引入有利于TEE Committee操作员和任务更有组织的结构化。并为未来的增强奠定了基础,包括奖励机制和法定人数之间权益分配的约束。
TEE Quorum的概念与 Eigenlayer 使用的 Quorum 定义一致,但每个 Quorum 都与一个 TEE 平台相关联,例如 Intel SGX。每个 Quorum 都属于一个委员会,操作员可以选择加入任何 Quorum,但只有拥有必要证明的操作员的投票才会被聚合器接受。
如果您有兴趣加入以太坊主网上的 Multi-Prover AVS,请访问Operator 设置存储库。入职指南可在此处获取。
从源代码编译
操作员
go build -o out/operator ./cmd/operator聚合器
go build -o out/aggregator ./cmd/aggregator相关文档
https://scroll.io/blog/scaling-security
https://blog.ata.network/verifiability-as-the-missing-piece-for-ai-agents-in-web3-504839dca893
https://blog.ata.network/towards-a-common-tee-stack-71a7812a4bf9
https://blog.ata.network/automata-joins-the-superchain-ecosystem-launching-on-optimisms-op-stack-da25840cc658
https://atanetwork.notion.site/Multi-Prover-AVS-with-TEE-545319c42885489196142d966f0ede86
https://gramine.readthedocs.io/en/stable/attestation.html
https://sgx101.gitbook.io/sgx101
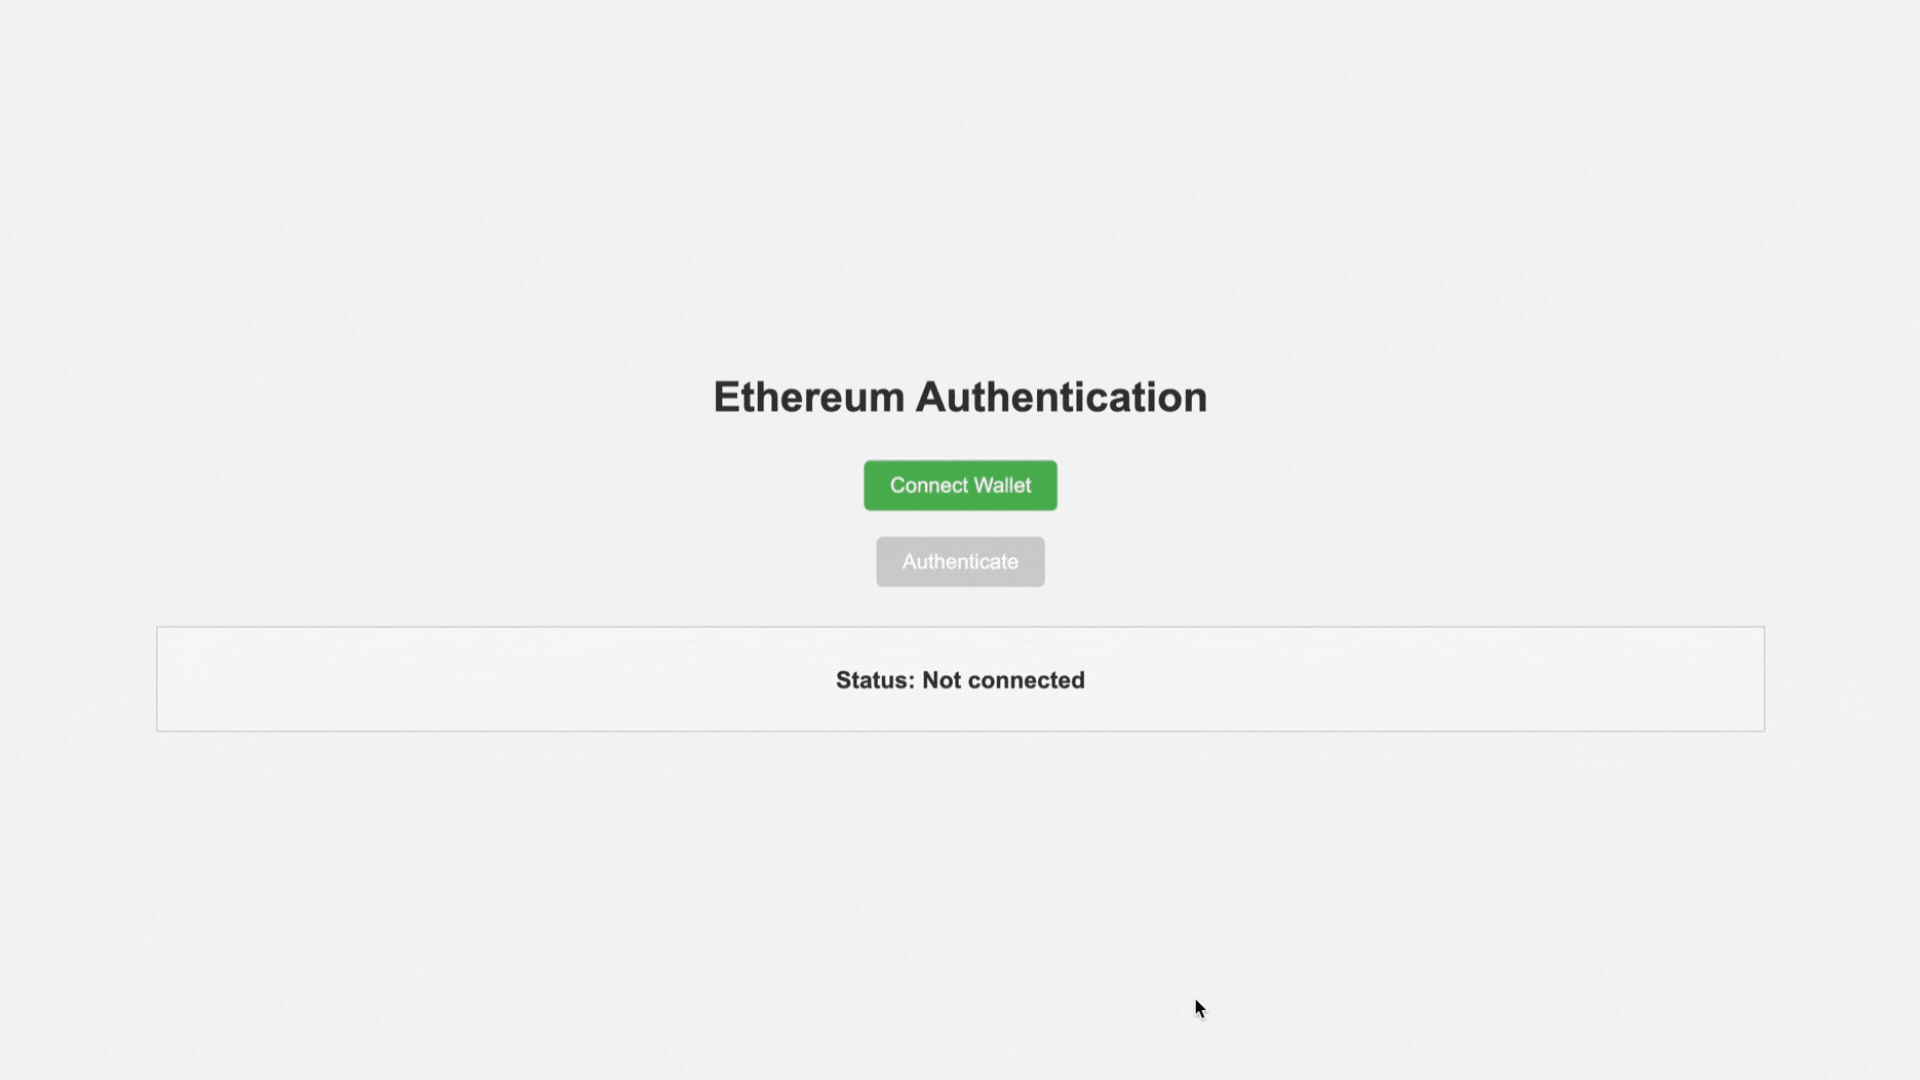
Go 语言实现 MetaMask 身份验证的演示
该项目演示了如何使用 MetaMask、Phantom 或任何其他支持以太坊网络的浏览器钱包对用户进行身份验证。它提供了一个简单的 Web 界面,允许用户连接他们的 MetaMask 钱包并显示他们的以太坊地址。
工作原理
此 Go 服务集成了 MetaMask 身份验证,使用以太坊区块链来验证用户。该服务提供两个主要 API 端点:/nonce和/auth。以下是该流程的工作原理概述:
1. 用户连接到 MetaMask:
- 前端提示用户连接他们的 MetaMask 钱包。
- 一旦用户批准连接,就会检索用户的以太坊帐户(钱包地址)。
2. 请求 Nonce(服务器端):
- 一旦连接,前端就会向服务器发送请求,以通过端点获取唯一的随机数/nonce。
- 服务器生成一个随机数并将其与用户的以太坊地址相关联。
- 该随机数被发送回给客户端。
3. 用户签署 Nonce(客户端):
- 前端使用 MetaMask 请求用户使用其私钥签署 nonce。
- MetaMask 提供签名,该签名在身份验证请求中发送回服务器。
4. 服务器验证签名:
- 服务器使用公共以太坊地址验证签名。
- 如果签名匹配,则认证成功。
- 然后,服务器可以发出会话令牌(或类似令牌)来管理用户会话。
安全说明:
Nonce 值用于防止重放攻击,确保每次身份验证尝试都是唯一的。
成功身份验证后安全地管理会话令牌(或其他形式的会话管理)非常重要。
eRPC — 容错 evm rpc 代理
介绍
eRPC 是一种容错 EVM RPC 代理和永久缓存解决方案。它在构建时充分考虑了读取密集型用例,例如数据索引和高负载前端使用。

doc: https://docs.erpc.cloud/
github: https://github.com/erpc/erpc
为什么选择 eRPC?
以下是构建 eRPC 的主要原因:
- 通过本地缓存来降低 RPC 使用和出站流量的总体成本。
- 在一个或多个提供商中断的情况下为 RPC 消费者提供容错且可靠的源。
- 为内部团队和项目以及上游 RPC 第三方公司提供对 RPC 使用情况的全球可观察性。
特征
- 通过跟踪响应时间、错误率、区块链同步状态等实现跨多个上游的故障转移。
- 为每个项目、网络或上游提供自我施加的速率限制,以避免滥用和无意的 DDoS。
- Prometheus 指标收集和 Grafana 仪表板用于监控RPC 端点的成本、使用情况和健康状况。
eRPC 可以在两个主要领域提供帮助:
- 缓存已进行的 RPC 调用(eth_getLogs、eth_call、eth_getBlockByNumber 等)
- 对 RPC 节点的上游压力进行速率限制以避免致命错误
与更传统的 LB 解决方案(ALB、K8S 服务等)相比,eRPC 将提供以 EVM 为中心的功能,例如:
- EVM 感知健康检查(例如落后多少个区块)
- EVM 感知回退(例如,如果 4xx 是由于缺少块而导致的,则尝试另一个上游)
- EVM 感知方法过滤器(例如,某些方法转到节点 A,其他方法转到节点 B)
缓存存储类型
- memory: 主要用于本地测试,或者不需要缓存太多数据
- redis:当您需要使用驱逐策略(例如一定量的内存)临时存储缓存数据时,Redis 很有用
- postgresql:当您需要永久存储缓存数据(无需 TTL,即永远)时很有用
- dynamodb:当您需要可扩展(与 Postgres 相比)的永久缓存并且更省存储成本
配置相关
- 数据库:配置缓存和数据库。
- 项目:定义具有不同速率限制预算的多个项目。
- 网络:为每个网络配置故障安全策略。
- 上游:使用故障安全策略、速率限制器、允许/拒绝方法等配置上游。
- 速率限制器:配置各种自我强加的预算,以防止对上游造成压力。
- 故障安全:解释用于网络和上游的不同策略,例如重试、超时和对冲。
配置实例
# 日志级别有助于调试或错误检测:
# - debug: 实际请求和响应的信息,以及有关速率限制的决策等.
# - info: 通常会打印成功路径,并且可能会对每个请求打印 1 个日志,以表明成功或失败.
# - warn: 这些问题不会导致最终用户出现问题,但可能表示数据降级或缓存数据库出现故障等问题.
# - error: 这些问题会对最终用户产生影响,例如配置错误.
logLevel: warn

# ERPC 中有各种数据库用例,例如缓存、动态配置、速率限制持久性等.
database:
  # `evmJsonRpcCache` 定义缓存 JSON-RPC 调用的目标,面向任何 EVM 架构上游.
  # 该数据库在关键路径上是非阻塞的,并且被用作尽力而为.
  # 确保存储要求满足你的使用情况,例如在 Arbitrum 上缓存 7000 万个区块 + 1000 万个交易 + 1000 万条记录需要 200GB 的存储空间.
  evmJsonRpcCache:
    # Refer to "Database" section for more details.
    # 请注意,如果表、模式和索引不存在,将自动创建.
    driver: postgresql
    postgresql:
      connectionUri: >-
        postgres://YOUR_USERNAME_HERE:YOUR_PASSWORD_HERE@your.postgres.hostname.here.com:5432/your_database_name
      table: rpc_cache

# eRPC 监听请求的主服务器.
server:
  listenV4: true
  httpHostV4: "0.0.0.0"
  listenV6: false
  httpHostV6: "[::]"
  httpPort: 4000
  maxTimeout: 30s

# 可选的 Prometheus 指标服务器.
metrics:
  enabled: true
  listenV4: true
  hostV4: "0.0.0.0"
  listenV6: false
  hostV6: "[::]"
  port: 4001

# 每个项目都是网络和上游的集合。
# 例如“后端”、“索引器”、“前端”,如果您只想使用 1 个项目,则可以将其命名为“main”
# 多个项目的主要目的是不同的故障安全策略(更积极且成本更高,或成本更低且更容易出错)
projects:
  - id: main

    # 您可以选择为每个项目定义一个自行设定的速率限制预算
    # 如果您想限制每秒的请求数或每日限额,这将非常有用。
    rateLimitBudget: frontend-budget

    # 此数组配置特定于网络(又称特定于链)的功能。
    # 对于每个网络,“架构”和相应的网络 ID(例如 evm.chainId)都是必需的。
    # 请记住,定义网络是可选的,因此仅当您想覆盖默认值时才提供这些。
    networks:
      - architecture: evm
        evm:
          chainId: 1
        # 有关更多详细信息,请参阅“故障安全”部分。
        # 在网络级别,“超时”适用于请求的整个生命周期(包括多次重试)
        failsafe:
          timeout:
            duration: 30s
          retry:
            maxCount: 3
            delay: 500ms
            backoffMaxDelay: 10s
            backoffFactor: 0.3
            jitter: 500ms
          # 强烈建议在网络级别定义“对冲”,因为如果上游 A 对某个特定请求的响应速度较慢,
          # 它可以向上游 B 启动一个新的并行对冲请求,以响应速度更快的一方为准。
          hedge:
            delay: 3000ms
            maxCount: 2
          circuitBreaker:
            failureThresholdCount: 30
            failureThresholdCapacity: 100
            halfOpenAfter: 60s
            successThresholdCount: 8
            successThresholdCapacity: 10
      - architecture: evm
        evm:
          chainId: 42161
        failsafe:
          timeout:
            duration: 30s
          retry:
            maxCount: 5
            delay: 500ms
            backoffMaxDelay: 10s
            backoffFactor: 0.3
            jitter: 200ms
          hedge:
            delay: 1000ms
            maxCount: 2

    # 每个上游支持 1 个或多个网络(chains)
    upstreams:
      - id: blastapi-chain-42161
        type: evm
        endpoint: https://arbitrum-one.blastapi.io/xxxxxxx-xxxxxx-xxxxxxx
        # 定义处理上游请求时使用哪个upstream
        rateLimitBudget: global-blast
        # chainId 是可选的,将从端点(eth_chainId)检测,但建议明确设置它,以便更快地初始化。
        evm:
          chainId: 42161
        # 哪些方法绝不能发送到上游:
        ignoreMethods:
          - "alchemy_*"
          - "eth_traceTransaction"
        # 请参阅“故障保护”部分以了解更多详细信息:
        failsafe:
          timeout:
            duration: 15s
          retry:
            maxCount: 2
            delay: 1000ms
            backoffMaxDelay: 10s
            backoffFactor: 0.3
            jitter: 500ms
      - id: blastapi-chain-1
        type: evm
        endpoint: https://eth-mainnet.blastapi.io/xxxxxxx-xxxxxx-xxxxxxx
        rateLimitBudget: global-blast
        evm:
          chainId: 1
        failsafe:
          timeout:
            duration: 15s
          retry:
            maxCount: 2
            delay: 1000ms
            backoffMaxDelay: 10s
            backoffFactor: 0.3
            jitter: 500ms
      - id: quiknode-chain-42161
        type: evm
        endpoint: https://xxxxxx-xxxxxx.arbitrum-mainnet.quiknode.pro/xxxxxxxxxxxxxxxxxxxxxxxx/
        rateLimitBudget: global-quicknode
        # 您可以禁用自动忽略不受支持的方法,而是明确定义它们.
        # 如果提供程序(例如 dRPC)与“不支持的方法”响应不一致,这将很有用.
        autoIgnoreUnsupportedMethods: false
        # 要允许自动批处理上游请求,请使用以下设置.
        # 请记住,如果“supportsBatch”为 false,您仍然可以向 eRPC 发送批量请求
        # 但它们将作为单独的请求发送到上游.
        jsonRpc:
          supportsBatch: true
          batchMaxSize: 10
          batchMaxWait: 100ms
        evm:
          chainId: 42161
        failsafe:
          timeout:
            duration: 15s
          retry:
            maxCount: 2
            delay: 1000ms
            backoffMaxDelay: 10s
            backoffFactor: 0.3
            jitter: 500ms

        # “id” 是区分日志和指标的唯一标识符.
      - id: alchemy-multi-chain-example
        # 对于某些已知提供商(例如 Alchemy),您可以使用自定义协议名称
        # 它允许单个上游导入该提供商支持的“所有链”。
        # 请注意,这些链在 repo 中是硬编码的,因此如果它们支持新的链,则必须更新 eRPC。
        endpoint: alchemy://XXXX_YOUR_ALCHEMY_API_KEY_HERE_XXXX
        rateLimitBudget: global
        failsafe:
          timeout:
            duration: 15s
          retry:
            maxCount: 2
            delay: 1000ms
            backoffMaxDelay: 10s
            backoffFactor: 0.3
            jitter: 500ms

# 速率限制器允许您为上游创建“共享”预算。
# 例如上游 A 和 B 可以使用相同的预算,这意味着它们两者加起来不得超过定义的限制。
rateLimiters:
  budgets:
    - id: default-budget
      rules:
        - method: "*"
          maxCount: 10000
          period: 1s
    - id: global-blast
      rules:
        - method: "*"
          maxCount: 1000
          period: 1s
    - id: global-quicknode
      rules:
        - method: "*"
          maxCount: 300
          period: 1s
    - id: frontend-budget
      rules:
        - method: "*"
          maxCount: 500
          period: 1s
部署测试
1. 新建docker-compose.yml
version: "3"

services:
  erpc:
    image: ghcr.io/erpc/erpc:0.0.26
    container_name: zksaas-server-erpc
    restart: always
    volumes:
      - ./erpc.yaml:/root/erpc.yaml
    logging:
      options:
        max-size: '500m'
        max-file: 3
    ports:
      - 4000:4000
      - 4001:4001
    depends_on:
      - redis
    networks:
      default:
      proxy:
        ipv4_address: 172.18.0.4

  monitoring:
    build: ./monitoring
    ports:
      - "3000:3000"  # Grafana
      - "9090:9090"  # Prometheus
    environment:
      - SERVICE_ENDPOINT=host.docker.internal
      - SERVICE_PORT=4001
    volumes:
      - ./monitoring/prometheus:/etc/prometheus
      - ./monitoring/grafana/grafana.ini:/etc/grafana/grafana.ini
      - ./monitoring/grafana/dashboards:/etc/grafana/dashboards
      - prometheus_data:/prometheus
      - grafana_data:/var/lib/grafana
    logging:
      options:
        max-size: '500m'
        max-file: 3

  redis:
    container_name: zksaas-erpc-redis
    image: redis:6.2.5
    restart: always
    ports:
      - "6379:6379"
    logging:
      options:
        max-size: '500m'
        max-file: 3
    networks:
      default:
      proxy:
        ipv4_address: 172.18.0.5

  # postgresql:
    # container_name: erpc-postgresql
    # image: postgres:13.4
    # restart: always
    # environment:
      # POSTGRES_USER: erpc
      # POSTGRES_PASSWORD: erpc
      # POSTGRES_DB: erpc
    # ports:
      # - "5432:5432"
    # networks:
      # erpc:

networks:
  default:
  proxy:
    external: true

volumes:
  prometheus_data:
  grafana_data:
配置中使用了固定ip,简化了部署流程,尤其对docker不熟悉情况下
2. 创建 erpc.yaml
根据上面模板,调整自己的节点配置,将erpc.yaml放到与docker-compose.yml同级目录
# Log level helps in debugging or error detection:
# - debug: information down to actual request and responses, and decisions about rate-liming etc.
# - info: usually prints happy paths and might print 1 log per request indicating of success or failure.
# - warn: these problems do not cause end-user problems, but might indicate degredataion or an issue such as cache databse being down.
# - error: these are problems that have end-user impact, such as misconfigurations.
logLevel: warn

# There are various use-cases of database in erpc, such as caching, dynamic configs, rate limit persistence, etc.
database:
  # `evmJsonRpcCache` defines the destination for caching JSON-RPC cals towards any EVM architecture upstream.
  # This database is non-blocking on critical path, and is used as best-effort.
  # Make sure the storage requirements meet your usage, for example caching 70m blocks + 10m txs + 10m traces on Arbitrum needs 200GB of storage.
  evmJsonRpcCache:
    # Refer to "Database" section for more details.
    # Note that table, schema and indexes will be created automatically if they don't exist.
    driver: redis
    redis:
      addr: 172.18.0.5:6379
      password:
      db: 0

# The main server for eRPC to listen for requests.
server:
  listenV4: true
  httpHostV4: "0.0.0.0"
  listenV6: false
  httpHostV6: "[::]"
  httpPort: 4000
  maxTimeout: 30s

# Optional Prometheus metrics server.
metrics:
  enabled: true
  listenV4: true
  hostV4: "0.0.0.0"
  listenV6: false
  hostV6: "[::]"
  port: 4001

# Each project is a collection of networks and upstreams.
# For example "backend", "indexer", "frontend", and you want to use only 1 project you can name it "main"
# The main purpose of multiple projects is different failsafe policies (more aggressive and costly, or less costly and more error-prone)
projects:
  - id: main
    healthCheck:
      scoreMetricsWindowSize: 1h
    # Optionally you can define a self-imposed rate limite budget for each project
    # This is useful if you want to limit the number of requests per second or daily allowance.
    rateLimitBudget: project-main-limit

    # This array configures network-specific (a.k.a chain-specific) features.
    # For each network "architecture" and corresponding network id (e.g. evm.chainId) is required.
    # Remember defining networks is OPTIONAL, so only provide these only if you want to override defaults.
    networks:
      - architecture: evm
        evm:
          chainId: 20241024
          finalityDepth: 5

        # A network-level rate limit budget applied to all requests despite upstreams own rate-limits.
        # For example even if upstreams can handle 1000 RPS, and network-level is limited to 100 RPS,
        # the request will be rate-limited to 100 RPS.
        rateLimitBudget: project-main-network-20241024-limiter

        # Refer to "Failsafe" section for more details.
        # On network-level "timeout" is applied for the whole lifecycle of the request (including however many retries)
        failsafe:
          timeout:
            duration: 30s
          # On network-level retry policy applies to the incoming request to eRPC,
          # this is additional to the retry policy set on upstream level.
          retry:
            # Total retries besides the initial request:
            maxCount: 3
            # Min delay between retries:
            delay: 500ms
            # Maximum delay between retries:
            backoffMaxDelay: 10s
            # Multiplier for each retry for exponential backoff:
            backoffFactor: 0.3
            # Random jitter to avoid thundering herd,
            # e.g. add between 0 to 500ms to each retry delay:
            jitter: 500ms
          # Defining a "hedge" is highly-recommended on network-level because if upstream A is being slow for
          # a specific request, it can start a new parallel hedged request to upstream B, for whichever responds faster.
          hedge:
            # Delay means how long to wait before starting a simultaneous hedged request.
            # e.g. if upstream A did not respond within 500ms, a new request towards upstream B will be started,
            # and whichever responds faster will be returned to the client.
            delay: 500ms
            # In total how many hedges to start.
            # e.g. if maxCount is 2, and upstream A did not respond within 500ms,
            # a new request towards upstream B will be started. If B also did not respond,
            # a new request towards upstream C will be started.
            maxCount: 1
          circuitBreaker:
            failureThresholdCount: 30
            failureThresholdCapacity: 100
            halfOpenAfter: 60s
            successThresholdCount: 8
            successThresholdCapacity: 10

    # Each upstream supports 1 or more networks (chains)
    upstreams:
      - id: zksaas-mainnet-20241024-rpc-1
        type: evm
        endpoint: http://172.18.39.154:8123
        rateLimitBudget: project-main-upstream-20241024-limiter
        # You can disable auto-ignoring unsupported methods, and instead define them explicitly.
        # This is useful if provider (e.g. dRPC) is not consistent with "unsupported method" responses.
        autoIgnoreUnsupportedMethods: false
        # To allow auto-batching requests towards the upstream, use these settings.
        # Remember if "supportsBatch" is false, you still can send batch requests to eRPC
        # but they will be sent to upstream as individual requests.
        jsonRpc:
          supportsBatch: true
          batchMaxSize: 10
          batchMaxWait: 100ms
        evm:
          chainId: 20241024
          nodeType: full # Optional. Can be "full" or "archive"
        # Which methods must never be sent to this upstream:
        #ignoreMethods:
        #  - "optimism_*"
        #  - "debug_traceTransaction"

        # Explicitly allowed methods will take precedence over ignoreMethods.
        # For example if you only want eth_getLogs to be served, set ignore methods to "*" and allowMethods to "eth_getLogs".
        #allowMethods:
        #  - "eth_getLogs"


        failsafe:
          timeout:
            # Upstream-level timeout applies each request sent towards the upstream,
            # e.g. if retry policy is set to 2 retries total time will be 30s for:
            duration: 15s
          # Upstream-level retry policy applies each request sent towards the upstream,
          # this is additional to the retry policy set on network level.
          # For example if network has 2 retries and upstream has 2 retries,
          # total retries will be 4.
          retry:
            maxCount: 2
            delay: 1000ms
            backoffMaxDelay: 10s
            backoffFactor: 0.3
            jitter: 500ms
          circuitBreaker:
            # These two variables indicate how many failures and capacity to tolerate before opening the circuit.
            failureThresholdCount: 30
            failureThresholdCapacity: 100
            # How long to wait before trying to re-enable the upstream after circuit breaker was opened.
            halfOpenAfter: 60s
            # These two variables indicate how many successes are required in half-open state before closing the circuit,
            # and putting the upstream back in available upstreams.
            successThresholdCount: 8
            successThresholdCapacity: 10

      - id: zksaas-mainnet-20241024-rpc-2
        type: evm
        endpoint: http://172.18.39.155:8123
        rateLimitBudget: project-main-upstream-20241024-limiter
        # You can disable auto-ignoring unsupported methods, and instead define them explicitly.
        # This is useful if provider (e.g. dRPC) is not consistent with "unsupported method" responses.
        autoIgnoreUnsupportedMethods: false
        # To allow auto-batching requests towards the upstream, use these settings.
        # Remember if "supportsBatch" is false, you still can send batch requests to eRPC
        # but they will be sent to upstream as individual requests.
        jsonRpc:
          supportsBatch: true
          batchMaxSize: 10
          batchMaxWait: 100ms
        evm:
          chainId: 20241024
          nodeType: full # Optional. Can be "full" or "archive"
        # Which methods must never be sent to this upstream:
        #ignoreMethods:
        #  - "optimism_*"
        #  - "debug_traceTransaction"

        # Explicitly allowed methods will take precedence over ignoreMethods.
        # For example if you only want eth_getLogs to be served, set ignore methods to "*" and allowMethods to "eth_getLogs".
        #allowMethods:
        #  - "eth_getLogs"

        failsafe:
          timeout:
            # Upstream-level timeout applies each request sent towards the upstream,
            # e.g. if retry policy is set to 2 retries total time will be 30s for:
            duration: 15s
          # Upstream-level retry policy applies each request sent towards the upstream,
          # this is additional to the retry policy set on network level.
          # For example if network has 2 retries and upstream has 2 retries,
          # total retries will be 4.
          retry:
            maxCount: 2
            delay: 1000ms
            backoffMaxDelay: 10s
            backoffFactor: 0.3
            jitter: 500ms
          circuitBreaker:
            # These two variables indicate how many failures and capacity to tolerate before opening the circuit.
            failureThresholdCount: 30
            failureThresholdCapacity: 100
            # How long to wait before trying to re-enable the upstream after circuit breaker was opened.
            halfOpenAfter: 60s
            # These two variables indicate how many successes are required in half-open state before closing the circuit,
            # and putting the upstream back in available upstreams.
            successThresholdCount: 8
            successThresholdCapacity: 10

      - id: zksaas-mainnet-20241024-rpc-3
        type: evm
        endpoint: http://172.18.34.68:8123
        rateLimitBudget: project-main-upstream-20241024-limiter
        # You can disable auto-ignoring unsupported methods, and instead define them explicitly.
        # This is useful if provider (e.g. dRPC) is not consistent with "unsupported method" responses.
        autoIgnoreUnsupportedMethods: false
        # To allow auto-batching requests towards the upstream, use these settings.
        # Remember if "supportsBatch" is false, you still can send batch requests to eRPC
        # but they will be sent to upstream as individual requests.
        jsonRpc:
          supportsBatch: true
          batchMaxSize: 10
          batchMaxWait: 100ms
        evm:
          chainId: 20241024
          nodeType: full # Optional. Can be "full" or "archive"
        # Which methods must never be sent to this upstream:
        #ignoreMethods:
        #  - "optimism_*"
        #  - "debug_traceTransaction"

        # Explicitly allowed methods will take precedence over ignoreMethods.
        # For example if you only want eth_getLogs to be served, set ignore methods to "*" and allowMethods to "eth_getLogs".
        #allowMethods:
        #  - "eth_getLogs"


        failsafe:
          timeout:
            # Upstream-level timeout applies each request sent towards the upstream,
            # e.g. if retry policy is set to 2 retries total time will be 30s for:
            duration: 15s
          # Upstream-level retry policy applies each request sent towards the upstream,
          # this is additional to the retry policy set on network level.
          # For example if network has 2 retries and upstream has 2 retries,
          # total retries will be 4.
          retry:
            maxCount: 2
            delay: 1000ms
            backoffMaxDelay: 10s
            backoffFactor: 0.3
            jitter: 500ms
          circuitBreaker:
            # These two variables indicate how many failures and capacity to tolerate before opening the circuit.
            failureThresholdCount: 30
            failureThresholdCapacity: 100
            # How long to wait before trying to re-enable the upstream after circuit breaker was opened.
            halfOpenAfter: 60s
            # These two variables indicate how many successes are required in half-open state before closing the circuit,
            # and putting the upstream back in available upstreams.
            successThresholdCount: 8
            successThresholdCapacity: 10

# Rate limiter allows you to create "shared" budgets for upstreams.
# For example upstream A and B can use the same budget, which means both of them together must not exceed the defined limits.
rateLimiters:
  budgets:
    - id: project-main-limit
      rules:
        - method: "*"
          maxCount: 10000000
          period: 1s

    - id: project-main-network-20241024-limiter
      rules:
        - method: "*"
          maxCount: 10000000
          period: 1s

    - id: project-main-upstream-20241024-limiter
      rules:
        - method: "*"
          maxCount: 10000000
          period: 1s
上面配置中,主要关心的测试数据如下
- 链id: 20241024
- 负载了三个节点
- http://172.18.39.154:8123
- http://172.18.39.155:8123
- http://172.18.34.68:8123
对于其它链,直接参照例子修改以上数据即可
3. 启动
docker-compose up -d性能对比分析
当前测试链基于Polygon CDK,本身性能瓶颈较大
| RPC | 先前 | 当前 | 提升比例 |
|---|---|---|---|
| eth_blockNumber | 4706.53 | 14688.22 | 312% |
| eth_gasPrice | 3029.96 | 16766.31 | 553% |
| eth_getBalance | 4771.16 | 15127.23 | 317% |
| eth_getTransactionReceipt | 2837.64 | 7885.16 | 277% |
| eth_getTransactionCount | 4883.25 | 15010.97 | 307% |
总结
- ERPC 尤其对于低频数据,效果提升明显,目前测试带宽也有受限,可能性能没有最大
- 通过跟踪响应时间、错误率、区块链同步状态等实现跨多个上游的故障转移
- 对于存储,支持redis 优先缓存较新区间,较高性能。以及postgresql永久存储 可以根据实际场景进行选择